
Notice
Recent Posts
Recent Comments
Link
250x250
| 일 | 월 | 화 | 수 | 목 | 금 | 토 |
|---|---|---|---|---|---|---|
| 1 | 2 | 3 | 4 | 5 | 6 | 7 |
| 8 | 9 | 10 | 11 | 12 | 13 | 14 |
| 15 | 16 | 17 | 18 | 19 | 20 | 21 |
| 22 | 23 | 24 | 25 | 26 | 27 | 28 |
Tags
- 데이터 시각화
- KLUE
- matplotlib
- Bert
- N21
- GPT
- 기아
- 딥러닝
- pyTorch
- Optimization
- Bart
- seaborn
- dataset
- N2N
- Data Viz
- word2vec
- nlp
- Self-attention
- passage retrieval
- mrc
- AI Math
- Ai
- 현대자동차
- AI 경진대회
- RNN
- Transformer
- Attention
- 2023 현대차·기아 CTO AI 경진대회
- ODQA
- 데이터 구축
Archives
- Today
- Total
쉬엄쉬엄블로그
(Data Viz) Scatter Plot 실습 본문
728x90
이 색깔은 주석이라 무시하셔도 됩니다.
!pip install matplotlib==3.3.2


import numpy as np
import pandas as pd
import matplotlib as mpl
import matplotlib.pyplot as plt
1. 기본 Scatter Plot
1-1. scatter() 기본
fig = plt.figure(figsize=(7, 7))
ax = fig.add_subplot(111, aspect=1)

np.random.seed(970725)

x = np.random.rand(20)
y = np.random.rand(20)

ax.scatter(x, y)
ax.set_xlim(0, 1.05)
ax.set_ylim(0, 1.05)

plt.show()
1-2. Scatter Plot의 요소
- 색 (color)
- 모양 (marker)
- 크기 (size)
fig = plt.figure(figsize=(7, 7))
ax = fig.add_subplot(111, aspect=1)

np.random.seed(970725)

x = np.random.rand(20)
y = np.random.rand(20)
s = np.arange(20) * 20

ax.scatter(x, y,
           s= s,
           c='white',
           marker='o',
           linewidth=1,
           edgecolor='black')

plt.show()
2. 정확한 Scatter Plot
- 이론적인 부분은 다른 라이브러리를 사용하는 것이 더 편리 (통계와 차트 seaborn에서 더 상세)
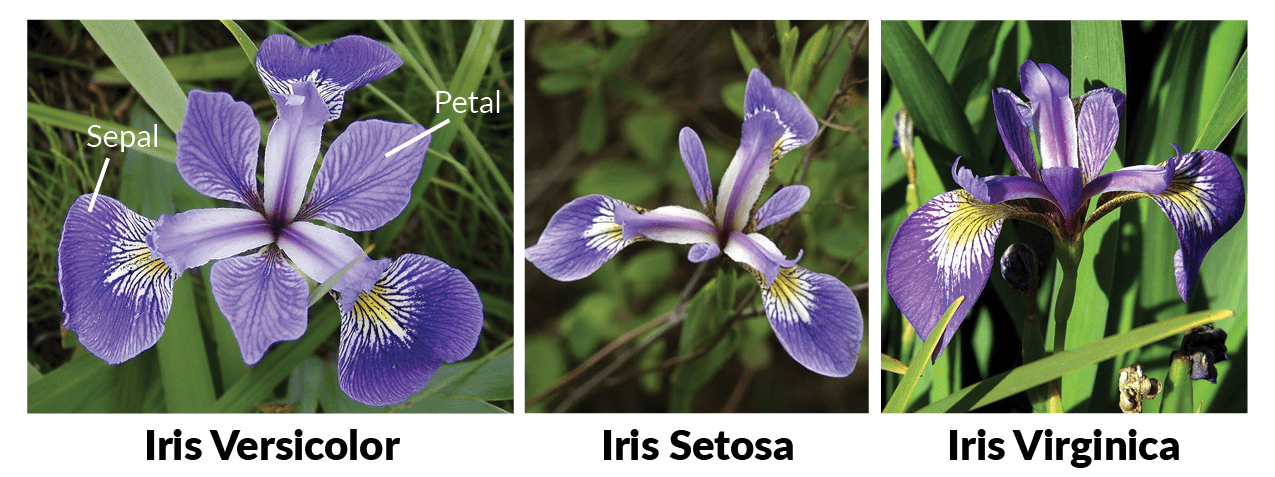
- 붓꽃 데이터셋을 사용하여 시각화
- 상관관계와 봐야 하는 것 3가지(클러스터, 값의 차이, 이상치)
- 어떻게 커스텀할 수 있는지
iris = pd.read_csv('./Iris.csv')
iris.head()
iris.describe(include='all')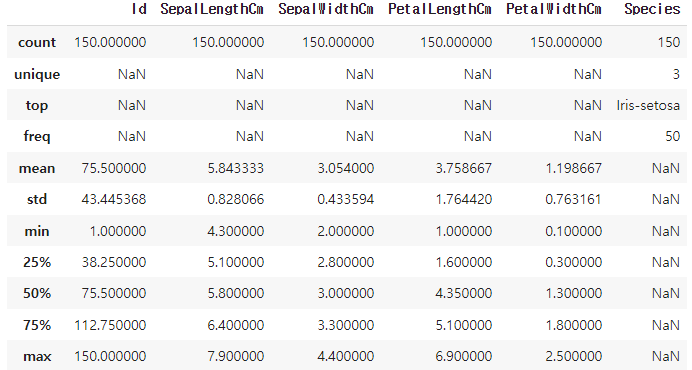
- 꽃받침의 길이와 너비의 관계를 살피기 위해 산점도 그리기
fig = plt.figure(figsize=(7, 7))
ax = fig.add_subplot(111)

ax.scatter(x=iris['SepalLengthCm'], y=iris['SepalWidthCm'])

plt.show()
- 특정 조건에 따라 색을 다르게 하기
fig = plt.figure(figsize=(7, 7))
ax = fig.add_subplot(111)

slc_mean = iris['SepalLengthCm'].mean()
swc_mean = iris['SepalWidthCm'].mean()

ax.scatter(x=iris['SepalLengthCm'],
           y=iris['SepalWidthCm'],
           c=['royalblue' if yy <= swc_mean else 'gray' for yy in iris['SepalWidthCm']]
          )

plt.show()
꽃의 종류에 따라 구분하여 그리기
- 색을 위와 같이 반복문과 조건문으로 구분할 수도 있지만 범례를 사용할 예정이므로 세 번 나눠 그리는 편이 더 편리
fig = plt.figure(figsize=(7, 7))
ax = fig.add_subplot(111)

for species in iris['Species'].unique():
    iris_sub = iris[iris['Species']==species]
    ax.scatter(x=iris_sub['SepalLengthCm'],
               y=iris_sub['SepalWidthCm'],
               label=species)

ax.legend()
plt.show()
fig = plt.figure(figsize=(7, 7))
ax = fig.add_subplot(111)

for species in iris['Species'].unique():
    iris_sub = iris[iris['Species']==species]
    ax.scatter(x=iris_sub['PetalLengthCm'],
               y=iris_sub['PetalWidthCm'],
               label=species)

ax.legend()
plt.show()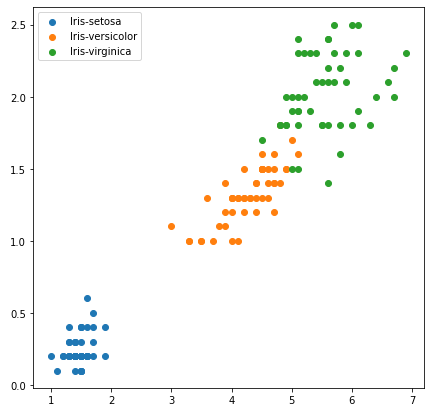
- 시각적인 주의를 주기 위해서 선을 사용할 수도 있음
fig = plt.figure(figsize=(7, 7))
ax = fig.add_subplot(111)

for species in iris['Species'].unique():
    iris_sub = iris[iris['Species']==species]
    ax.scatter(x=iris_sub['PetalLengthCm'],
               y=iris_sub['PetalWidthCm'],
               label=species)

ax.axvline(2.5, color='gray', linestyle=':')
ax.axhline(0.8, color='gray', linestyle=':')
ax.legend()
plt.show()
- 다양한 관점으로 그리기
fig, axes = plt.subplots(4, 4, figsize=(14, 14))

feat = ['SepalLengthCm', 'SepalWidthCm', 'PetalLengthCm', 'PetalWidthCm']

for i, f1 in enumerate(feat):
    for j, f2 in enumerate(feat):
        if i <= j :
            axes[i][j].set_visible(False)
            continue
        for species in iris['Species'].unique():
            iris_sub = iris[iris['Species']==species]
            axes[i][j].scatter(x=iris_sub[f2],
                               y=iris_sub[f1],
                               label=species,
                               alpha=0.7)
        if i == 3: axes[i][j].set_xlabel(f2)
        if j == 0: axes[i][j].set_ylabel(f1)

plt.tight_layout()
plt.show()
출처: 부스트캠프 AI Tech 4기(NAVER Connect Foundation)
'부스트캠프 AI Tech 4기' 카테고리의 다른 글
| (Data Viz) Color (+ 실습) (0) | 2023.06.14 |
|---|---|
| (Data Viz) Text (+ 실습) (0) | 2023.06.13 |
| (Data Viz) Scatter Plot (0) | 2023.06.12 |
| (Data Viz) Line Plot 실습 (0) | 2023.06.10 |
| (Data Viz) Line Plot (0) | 2023.06.10 |
'부스트캠프 AI Tech 4기' Related Articles
more


Comments