부스트캠프 AI Tech 4기
(Data Viz) Seaborn 기초 실습 - 1
쉬엄쉬엄블로그
2023. 6. 24. 19:14
728x90
이 색깔은 주석이라 무시하셔도 됩니다.
Seaborn 기초 실습
1. Seaborn의 구조 살펴보기
1-1. 라이브러리와 데이터셋 호출
import numpy as np
import pandas as pd
import matplotlib as mpl
import matplotlib.pyplot as plt
import seaborn as sns

print('seaborn version : ', sns.__version__)

"""
seaborn version :  0.11.2
"""
student = pd.read_csv('./StudentsPerformance.csv')
student.head()
1-2. Countplot으로 살펴보는 공통 파라미터
countplot은 seaborn의 Categorical API에서 대표적인 시각화로 범주를 이산적으로 세서 막대그래프로 그려주는 함수이다.
기본적으로 다음과 같은 파라미터가 있다. (df는 pandas의 DataFrame을 의미)
xydatahuehue_order
palettecolorsaturateax
이 중 x, y, hue 등은 기본적으로 df의 feature를 의미한다. (dict라면 key를 의미)
sns.countplot(x='race/ethnicity', data=student)
파라미터로 전달되는 x와 y값을 바꾸면 방향을 바꿀 수 있다.
sns.countplot(y='race/ethnicity',data=student)
하지만 x, y가 변경되었을 때, 두 축 모두 자료형이 같다면 방향 설정이 원하는 방식대로 진행이 되지 않을 수 있다.
이럴 때는 oriented를 v 또는 h로 전달하여 원하는 시각화를 진행할 수 있다.
order로 순서를 명시할 수 있다.
sns.countplot(x='race/ethnicity',data=student,
             order=sorted(student['race/ethnicity'].unique())

             )
hue는 색을 의미하는데, 데이터의 구분 기준을 정하여 색상을 통해 내용을 구분한다.
sns.countplot(x='race/ethnicity',data=student,
              hue='gender',
              order=sorted(student['race/ethnicity'].unique())
             )
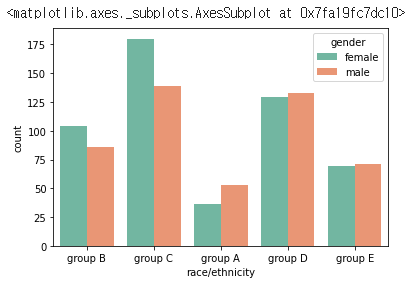
색은 palette를 변경하여 바꿀 수 있다.
sns.countplot(x='race/ethnicity',data=student,
              hue='gender', palette='Set2'
             )
hue로 지정된 그룹을 Gradient 색상을 전달할 수 있다.
sns.countplot(x='gender',data=student,
              hue='race/ethnicity', color='red'
             )
hue_order로 순서를 정해줄 수 있다.
sns.countplot(x='gender',data=student,
              hue='race/ethnicity',
              hue_order=sorted(student['race/ethnicity'].unique()) #, color='red'
             )
saturation 도 조정할 수 있지만 크게 추천하지는 않음
sns.countplot(x='gender',data=student,
              hue='race/ethnicity',
              hue_order=sorted(student['race/ethnicity'].unique()),
              saturation=0.3
             )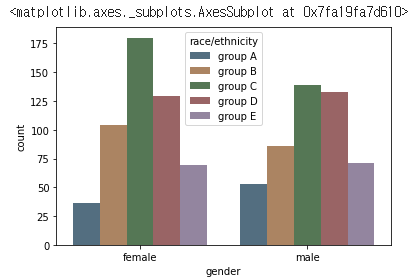
matplotlib과 함께 사용하기 적합하게 ax 를 지정하여 seaborn plot을 그릴 수 있다.
fig, axes = plt.subplots(1, 2, figsize=(12, 5))

sns.countplot(x='race/ethnicity',data=student,
              hue='gender',
              ax=axes[0]
             )

sns.countplot(x='gender',data=student,
              hue='race/ethnicity',
              hue_order=sorted(student['race/ethnicity'].unique()),
              ax=axes[1]
             )

plt.show()
출처: 부스트캠프 AI Tech 4기(NAVER Connect Foundation)